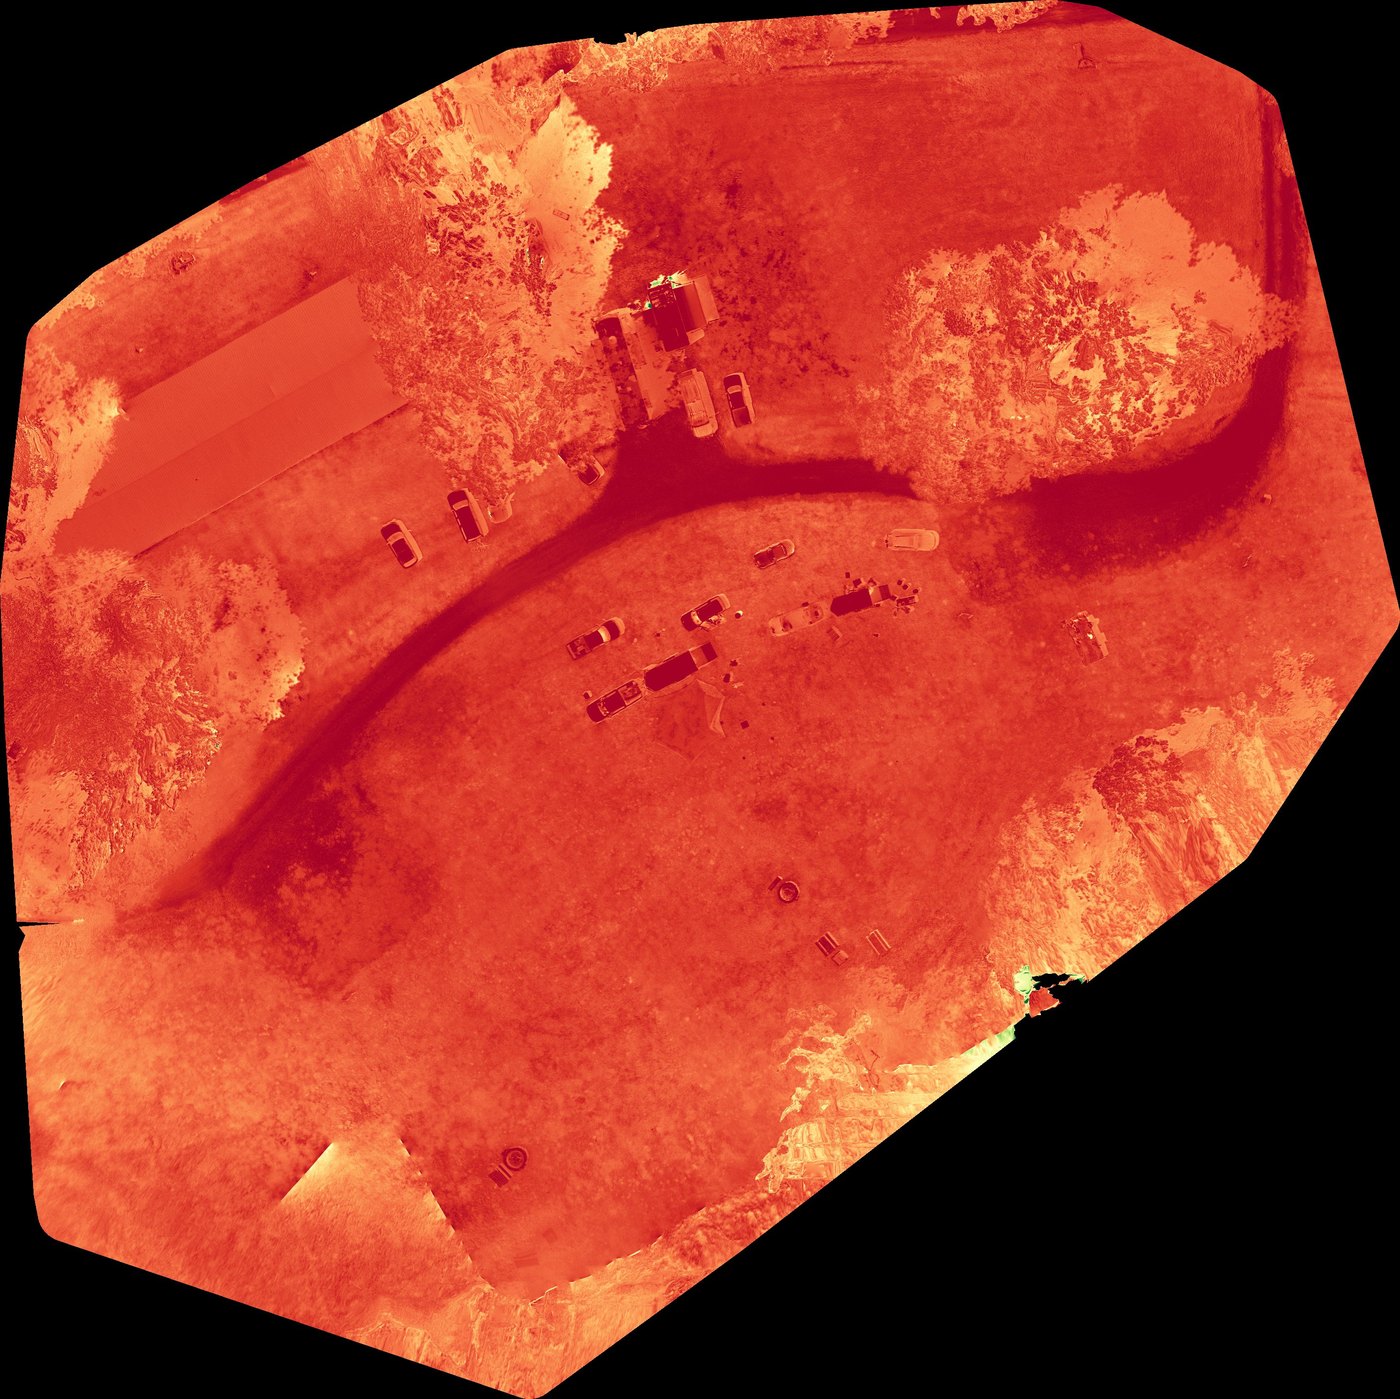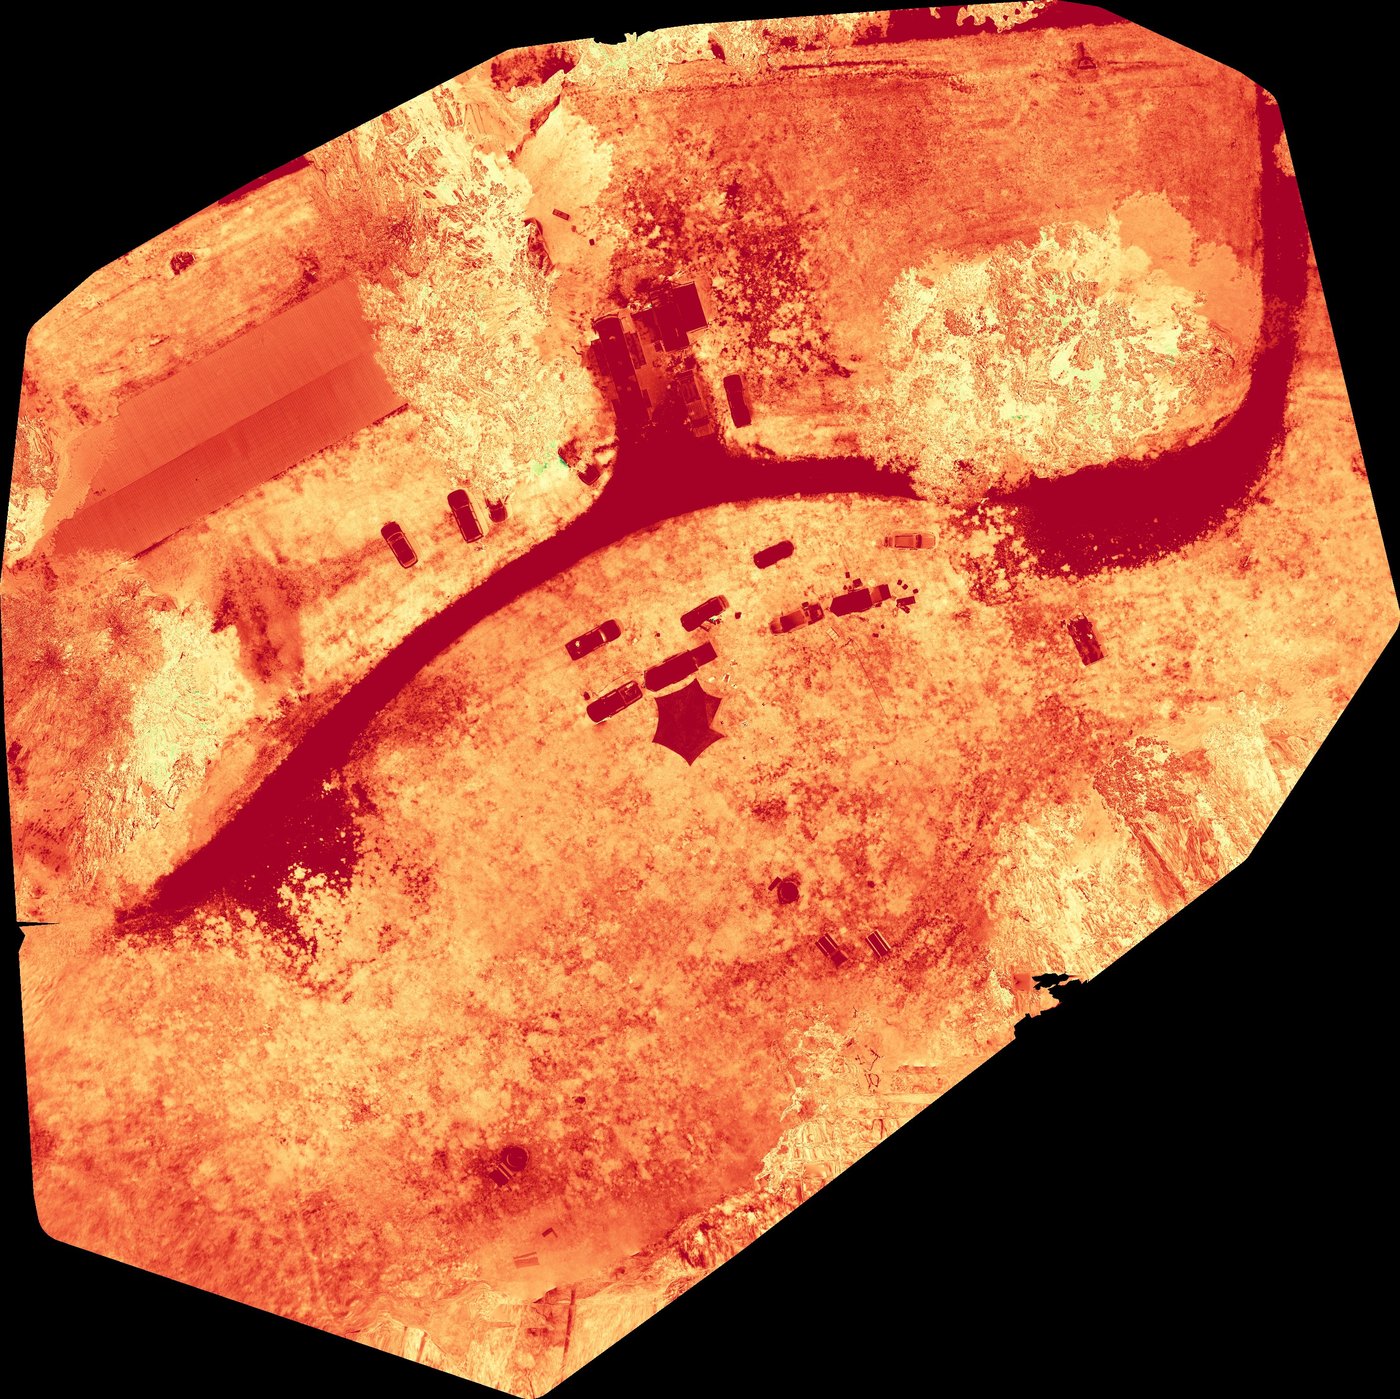
EVI vegetation index map background

A1 / Precision Agriculture

Drone Crop-Health Mapping (NDVI / NDRE) for Tennessee Growers

You can't fix what you can't see from the cab. We fly a multispectral sensor over your fields and turn one flight into a full set of vegetation maps — so you know where to scout before a problem spreads.
One flight, five views

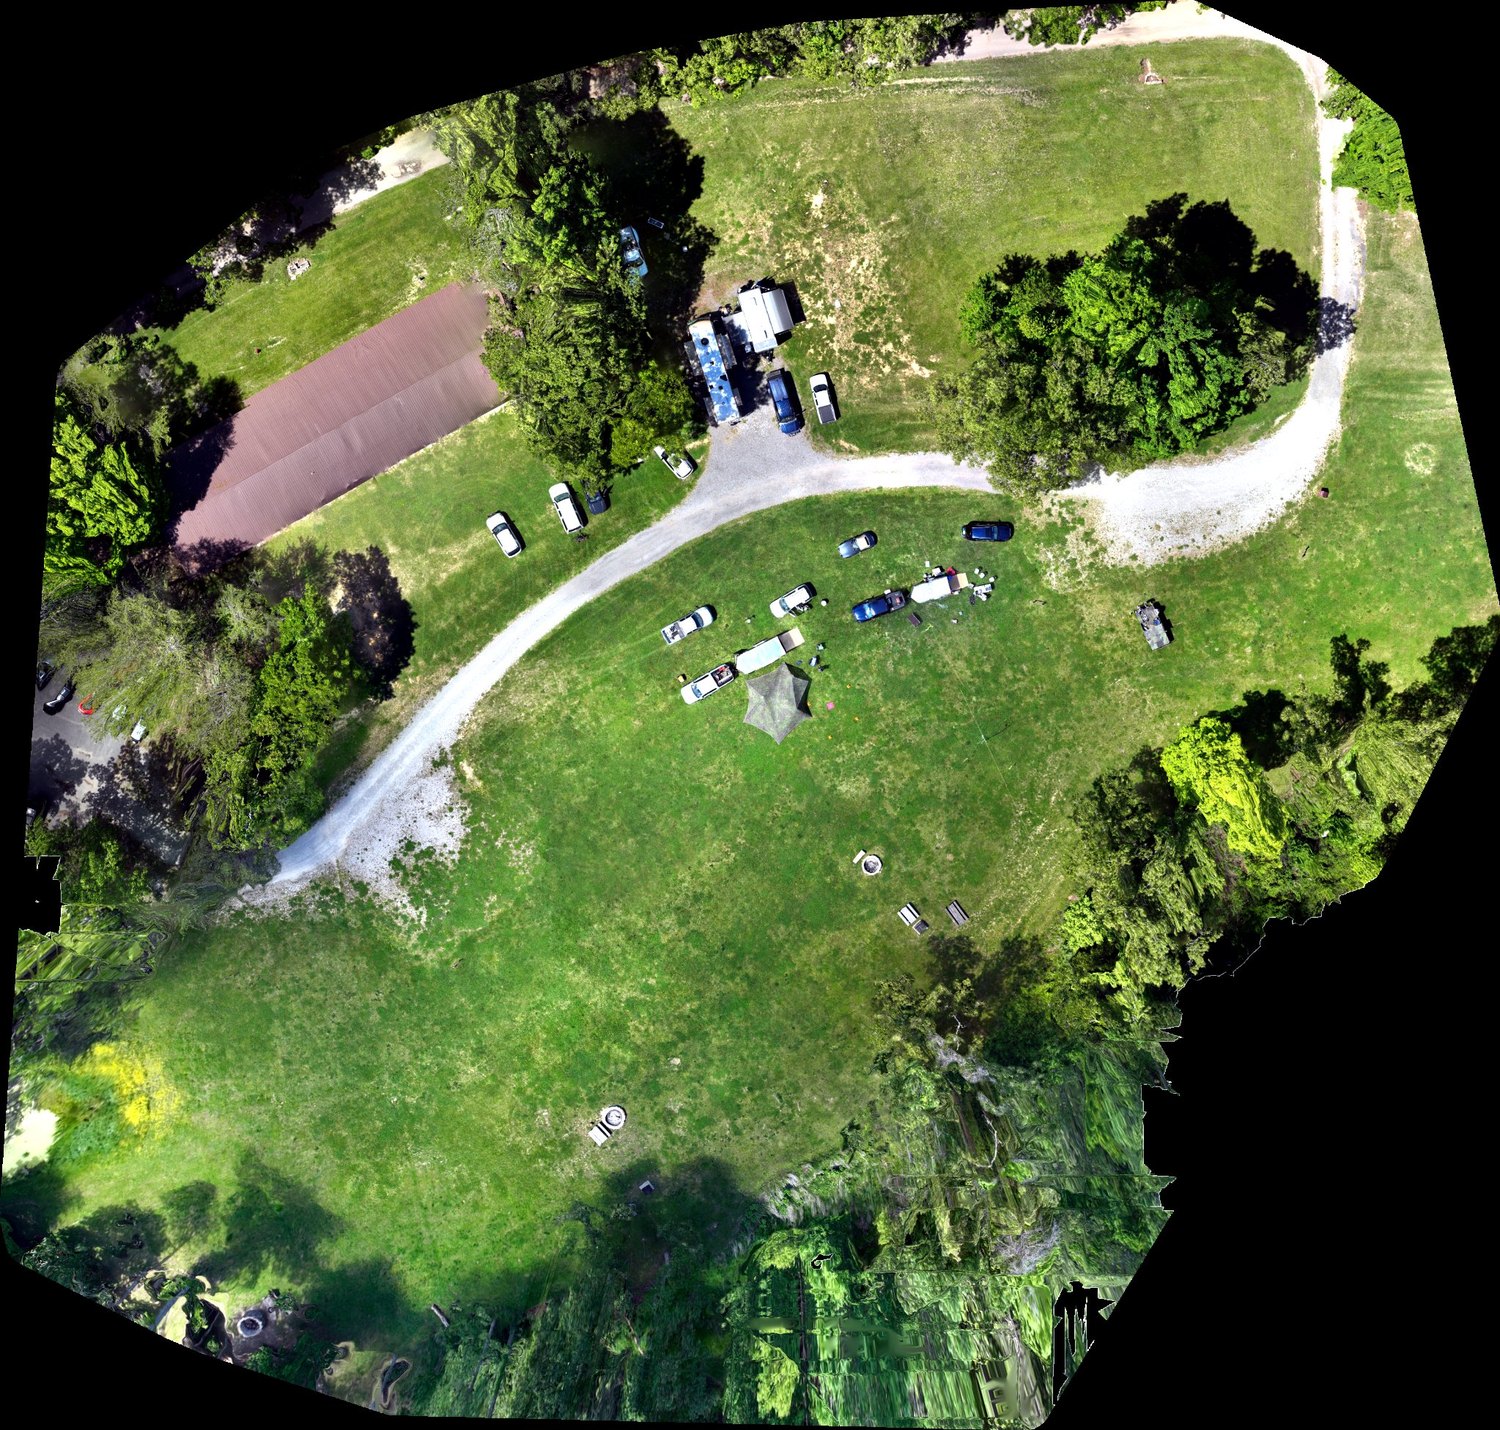
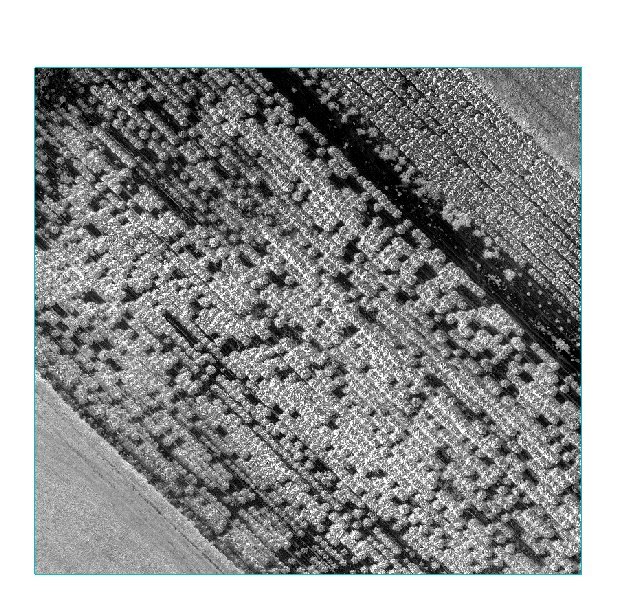
From a single multispectral mission you receive — in your secure portal — a measurable RGB orthomosaic plus four vegetation indices that cross-check each other.

RGB orthomosaic of a Middle Tennessee site from a UUAS multispectral drone flight
RGB ORTHOMEASURABLE MAP
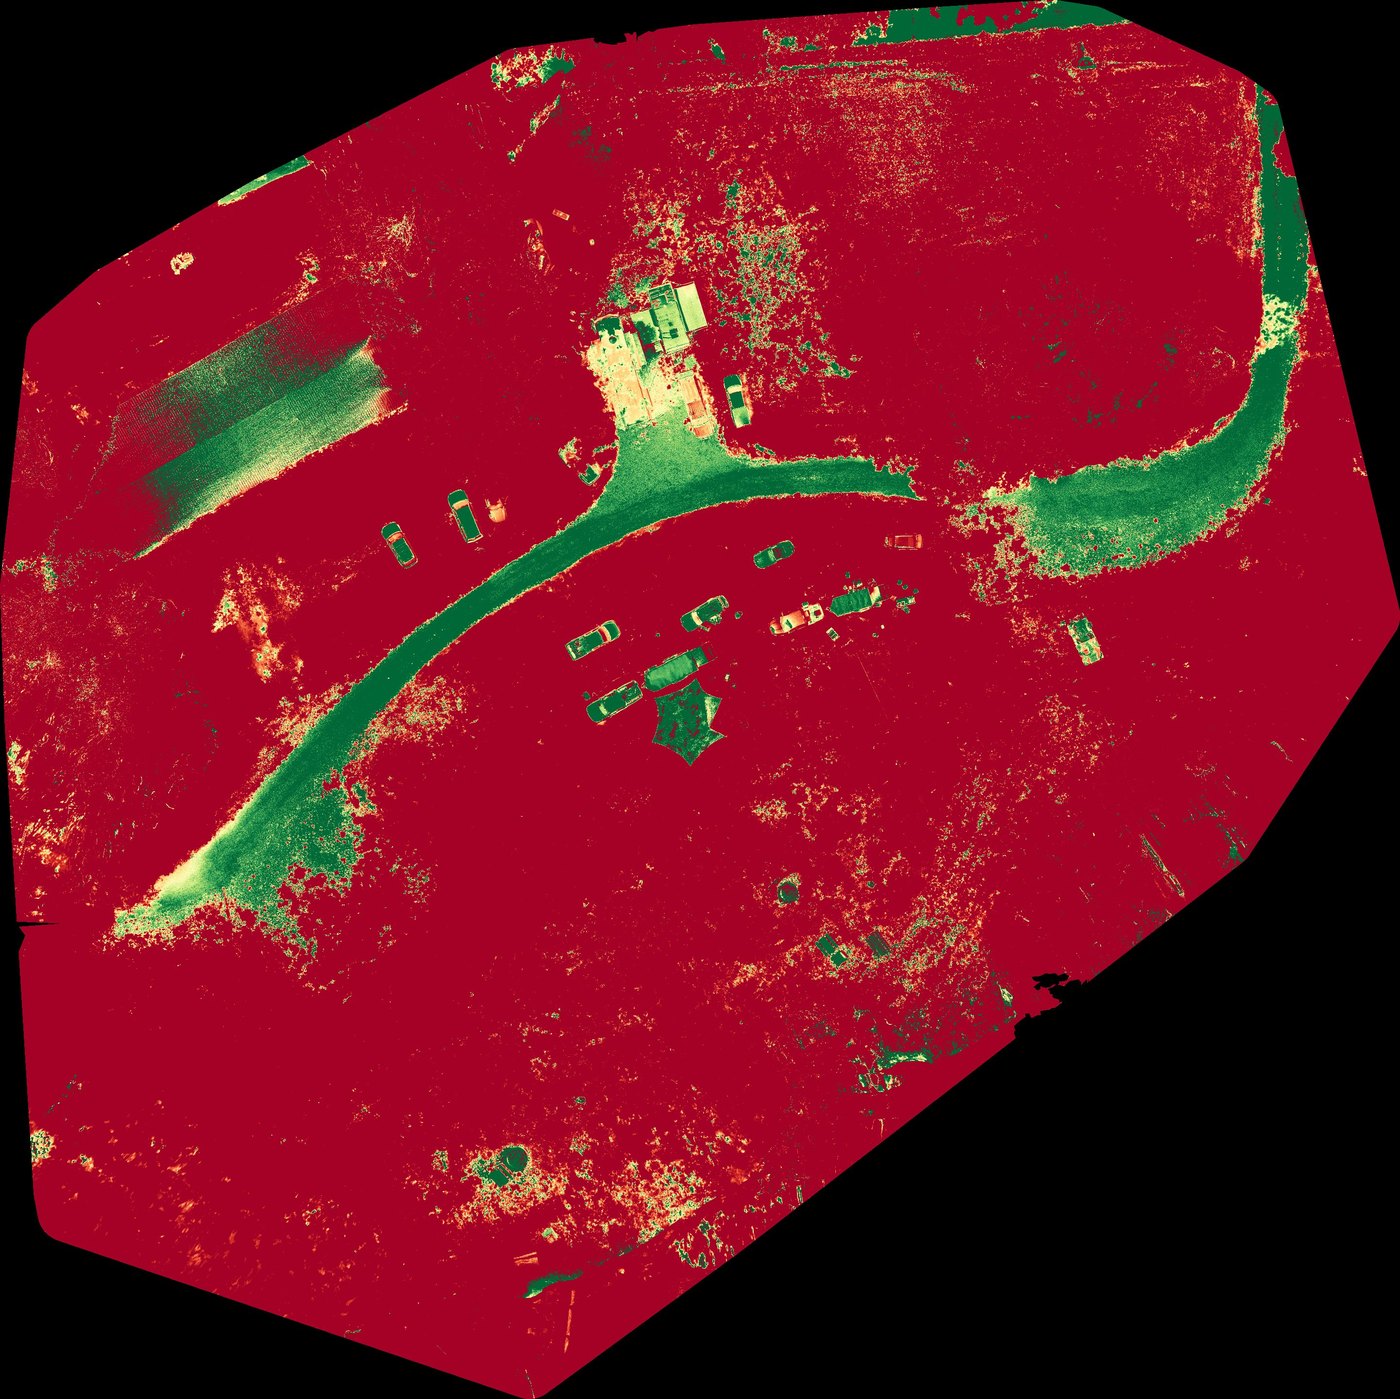
NDVI vegetation index map from the same multispectral flight
NDVISTRESS / VIGOR
EVI vegetation index map; green is vigorous vegetation and red is bare or stressed ground
EVIHIGH-BIOMASS
NDRE red-edge vegetation index used to assess dense canopy vigor
NDRERED-EDGE
GNDVI green-band vegetation index from the same flight
GNDVIGREEN-BAND

Reading the maps: green is vigorous vegetation; red is bare ground, stress, or non-crop surface. The set above is a real flight over a mixed-cover Middle TN site, shown as a capability demonstration — on a managed crop field your healthy canopy reads green and the trouble zones jump out in red.

What it gets you

This is mapping and analysis, not chemical application — we hand you the intelligence; you and your agronomist make the call. Every map is indexed, dated, and stored so you can compare flights over time.

Read the guide: what NDVI actually tells a grower (and what it doesn't) →

Map your fields this season.

Schedule a field scan